Welcome to Mao lab!
Differential Contributions of MYCs to Insect Defense Reveals Flavonoids Alleviating Growth Inhibition Caused by Wounding in Arabidopsis
Abstract In Arabidopsis, basic helix–loop–helix transcription factors (TFs) MYC2, MYC3, and MYC4 are involved in many biological processes, such as defense against insects. We found that despite functional redundancy, MYC-related mutants displayed different resistance to cotton bollworm (Helicoverpa armigera). To screen out the most likely genes involved in defense against insects, we analyzed the correlation of gene expression with cotton bollworm resistance in wild-type (WT) and MYC-related mutants. In total, the expression of 94 genes in untreated plants and 545 genes in wounded plants were strongly correlated with insect resistance, and these genes were defined as MGAIs (MYC-related genes against insects). MYC3 had the greatest impact on the total expression of MGAIs. Gene ontology (GO) analysis revealed that besides the biosynthesis pathway of glucosinolates (GLSs), MGAIs, which are well-known defense compounds, were also enriched in flavonoid biosynthesis. Moreover, MYC3 dominantly affected the gene expression of flavonoid biosynthesis. Weighted gene co-expression network analysis (WGCNA) revealed that AAE18, which is involved in activating auxin precursor 2,4-dichlorophenoxybutyric acid (2,4-DB) and two other auxin response genes, was highly co-expressed with flavonoid biosynthesis genes. With wounding treatment, the WT plants exhibited better growth performance than chalcone synthase (CHS), which was defective in flavonoid biosynthesis. The data demonstrated dominant contributions of MYC3 to cotton bollworm resistance and imply that flavonoids might alleviate the growth inhibition caused by wounding in Arabidopsis.
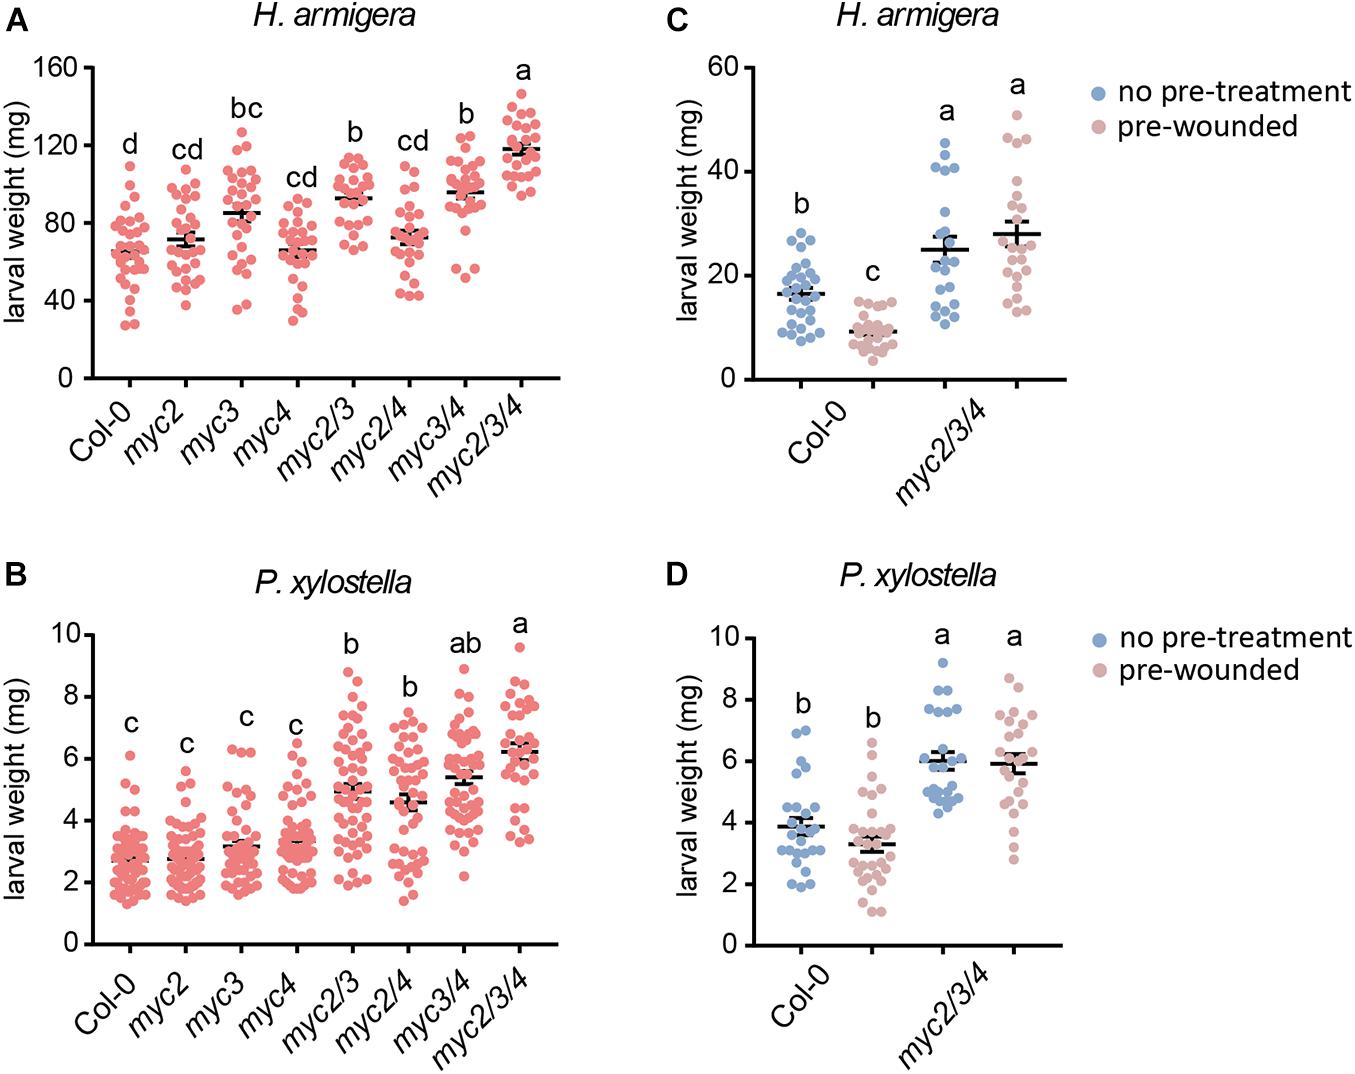
Figure 1. Involvement of MYC2, MYC3, and MYC4 in plant resistance to insect. Helicoverpa armigera (A,C) and P. xylostella (B,D) larvae were fed with the indicated plants for 4 days. In panels (C,D), the plants were wounded 1 day before being used for feeding. Data are means ± SEM (n = 25–35) analyzed by one-way ANOVA and Tukey’s honest significant difference (HSD) test. Different letters indicate significant differences, P-value < 0.05.
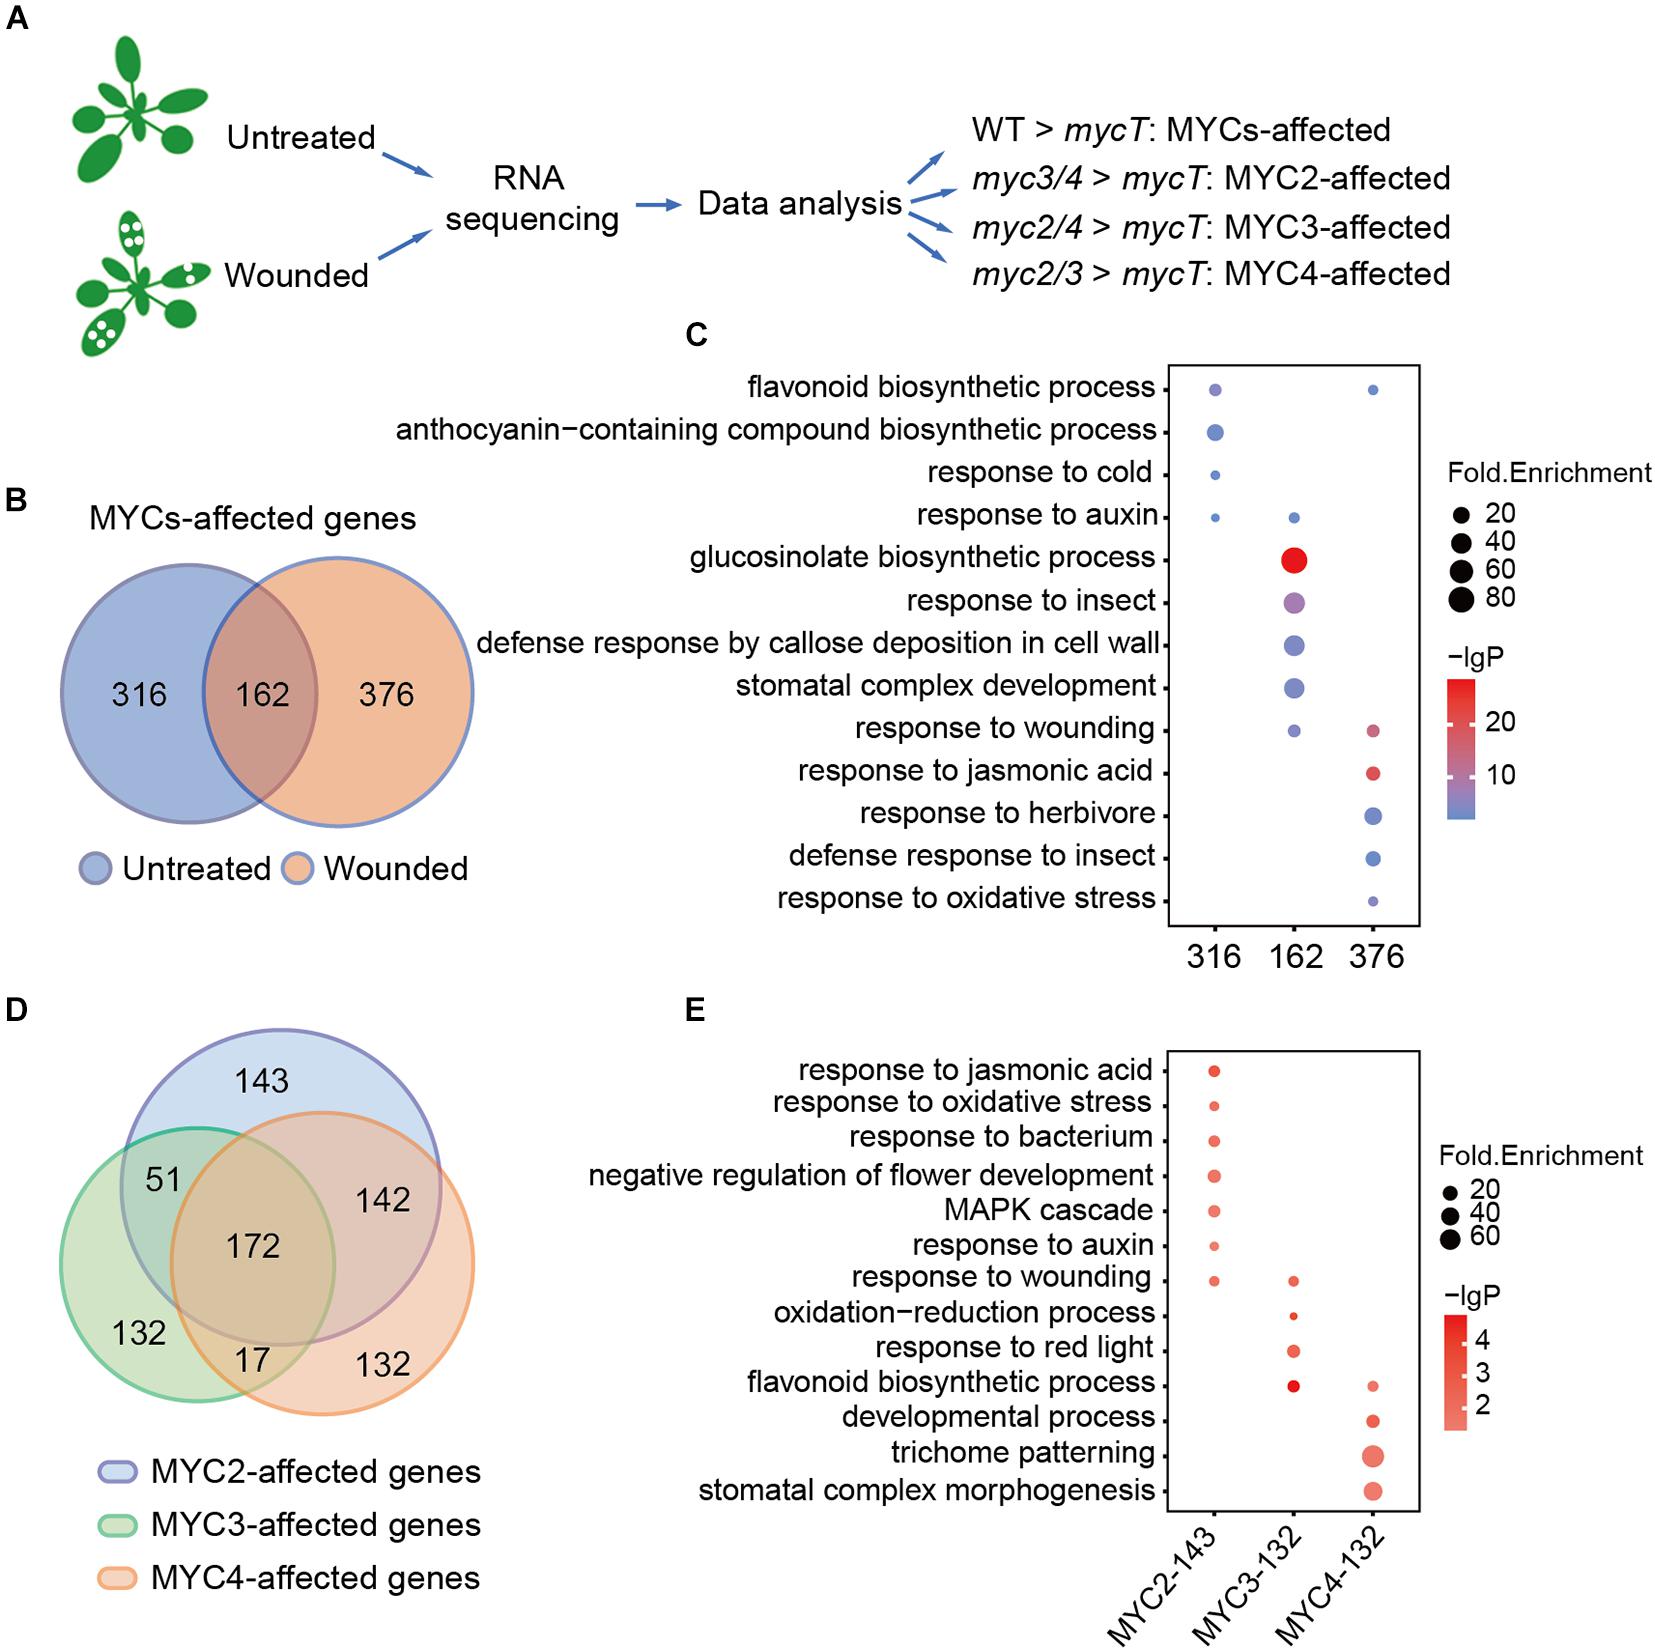
Figure 2. MYC2, MYC3, and MYC4 have different contributions in biological processes. (A) Workflow of sample collection, sequencing, and analysis. The untreated plants and the plants 4 h post wounding were collected and used for RNA sequencing and data analysis. (B) Venn diagram shows MYC-affected genes in the plants with (orange and wounded) or without (blue and untreated) wounding treatment. (C) GO enrichment analysis of 316, 162, and 376 MYC-affected genes as described in panel (B). (D) Venn diagram of MYC2-, MYC3-, and MYC4-affected genes in either untreated or wounded plants, which were described in Supplementary Figure 2A. (E) GO analysis of genes only affected by MYC2, MYC3, and MYC4, respectively. (C,E) The size of the dot represents fold enrichment, and color stands for –lg(P-value).
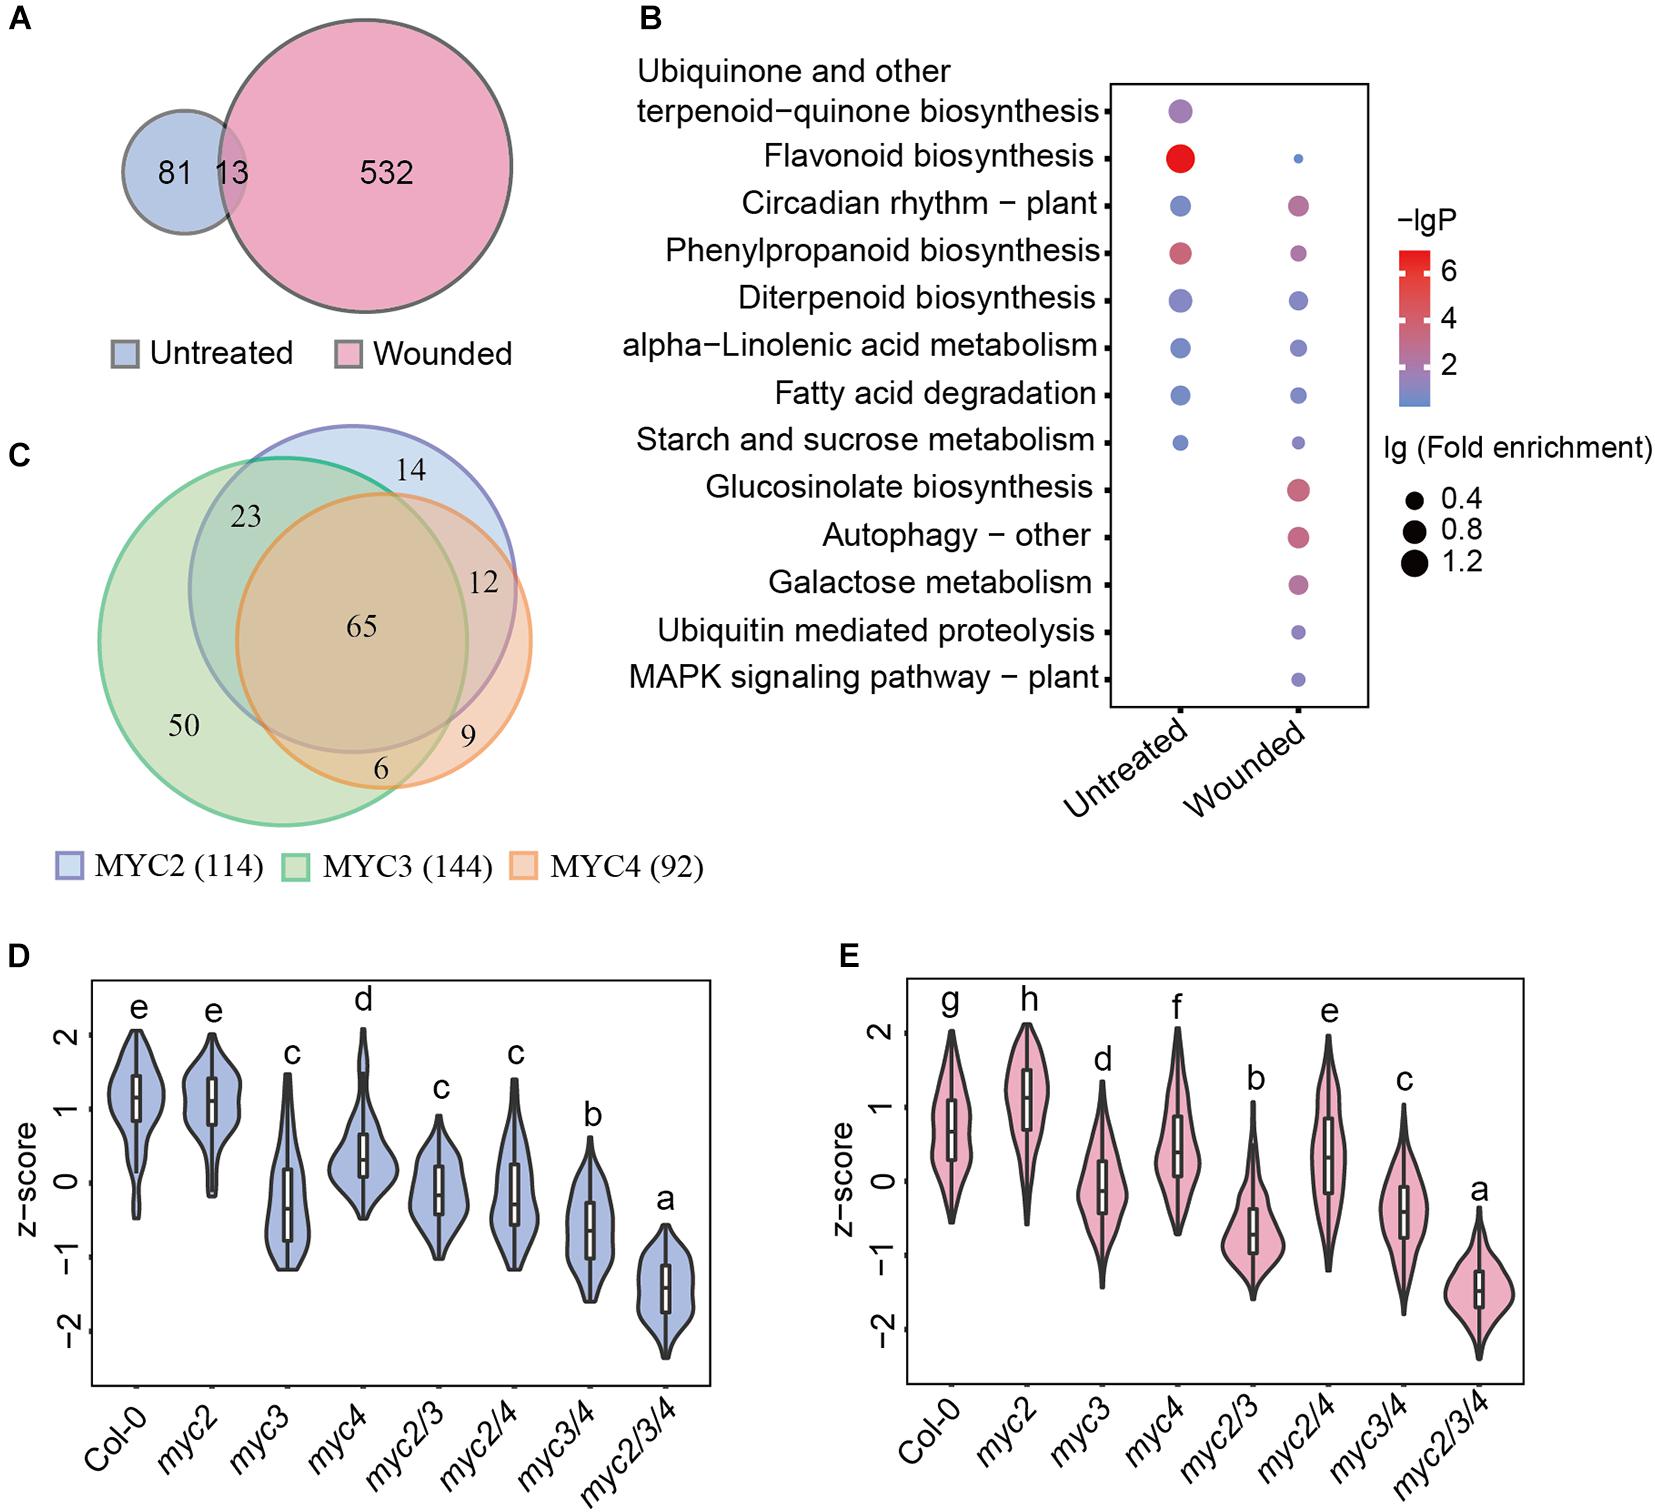
Figure 3. MYC3 has the most significant impacts on the MGAI expressions. (A) Venn diagram of MGAIs in untreated (blue) and wounded (red) plants. (B) GO enrichment analysis of MGAIs as described in panel (A). The dot represents lg (fold enrichment), and color stands for –lg(P-value). (C) Venn diagram of MYC2-, MYC3-, and MYC4-affected MGAIs. Blue, green, and orange, respectively, stand for the total MGAIs affected by MYC2, MYC3, and MYC4 in untreated and wounded plants as described in Supplementary Figure 5. (D,E) Expressions of the MGAIs obtained from the untreated (D) and the wounded (E) plants, as described in panel (A). The TPM of each gene was normalized into z-score. The detailed MGAI information is listed in Supplementary Table 11. Data are analyzed by one-way ANOVA and Tukey’s HSD test. Different letters indicate significant differences, P-value < 0.05.
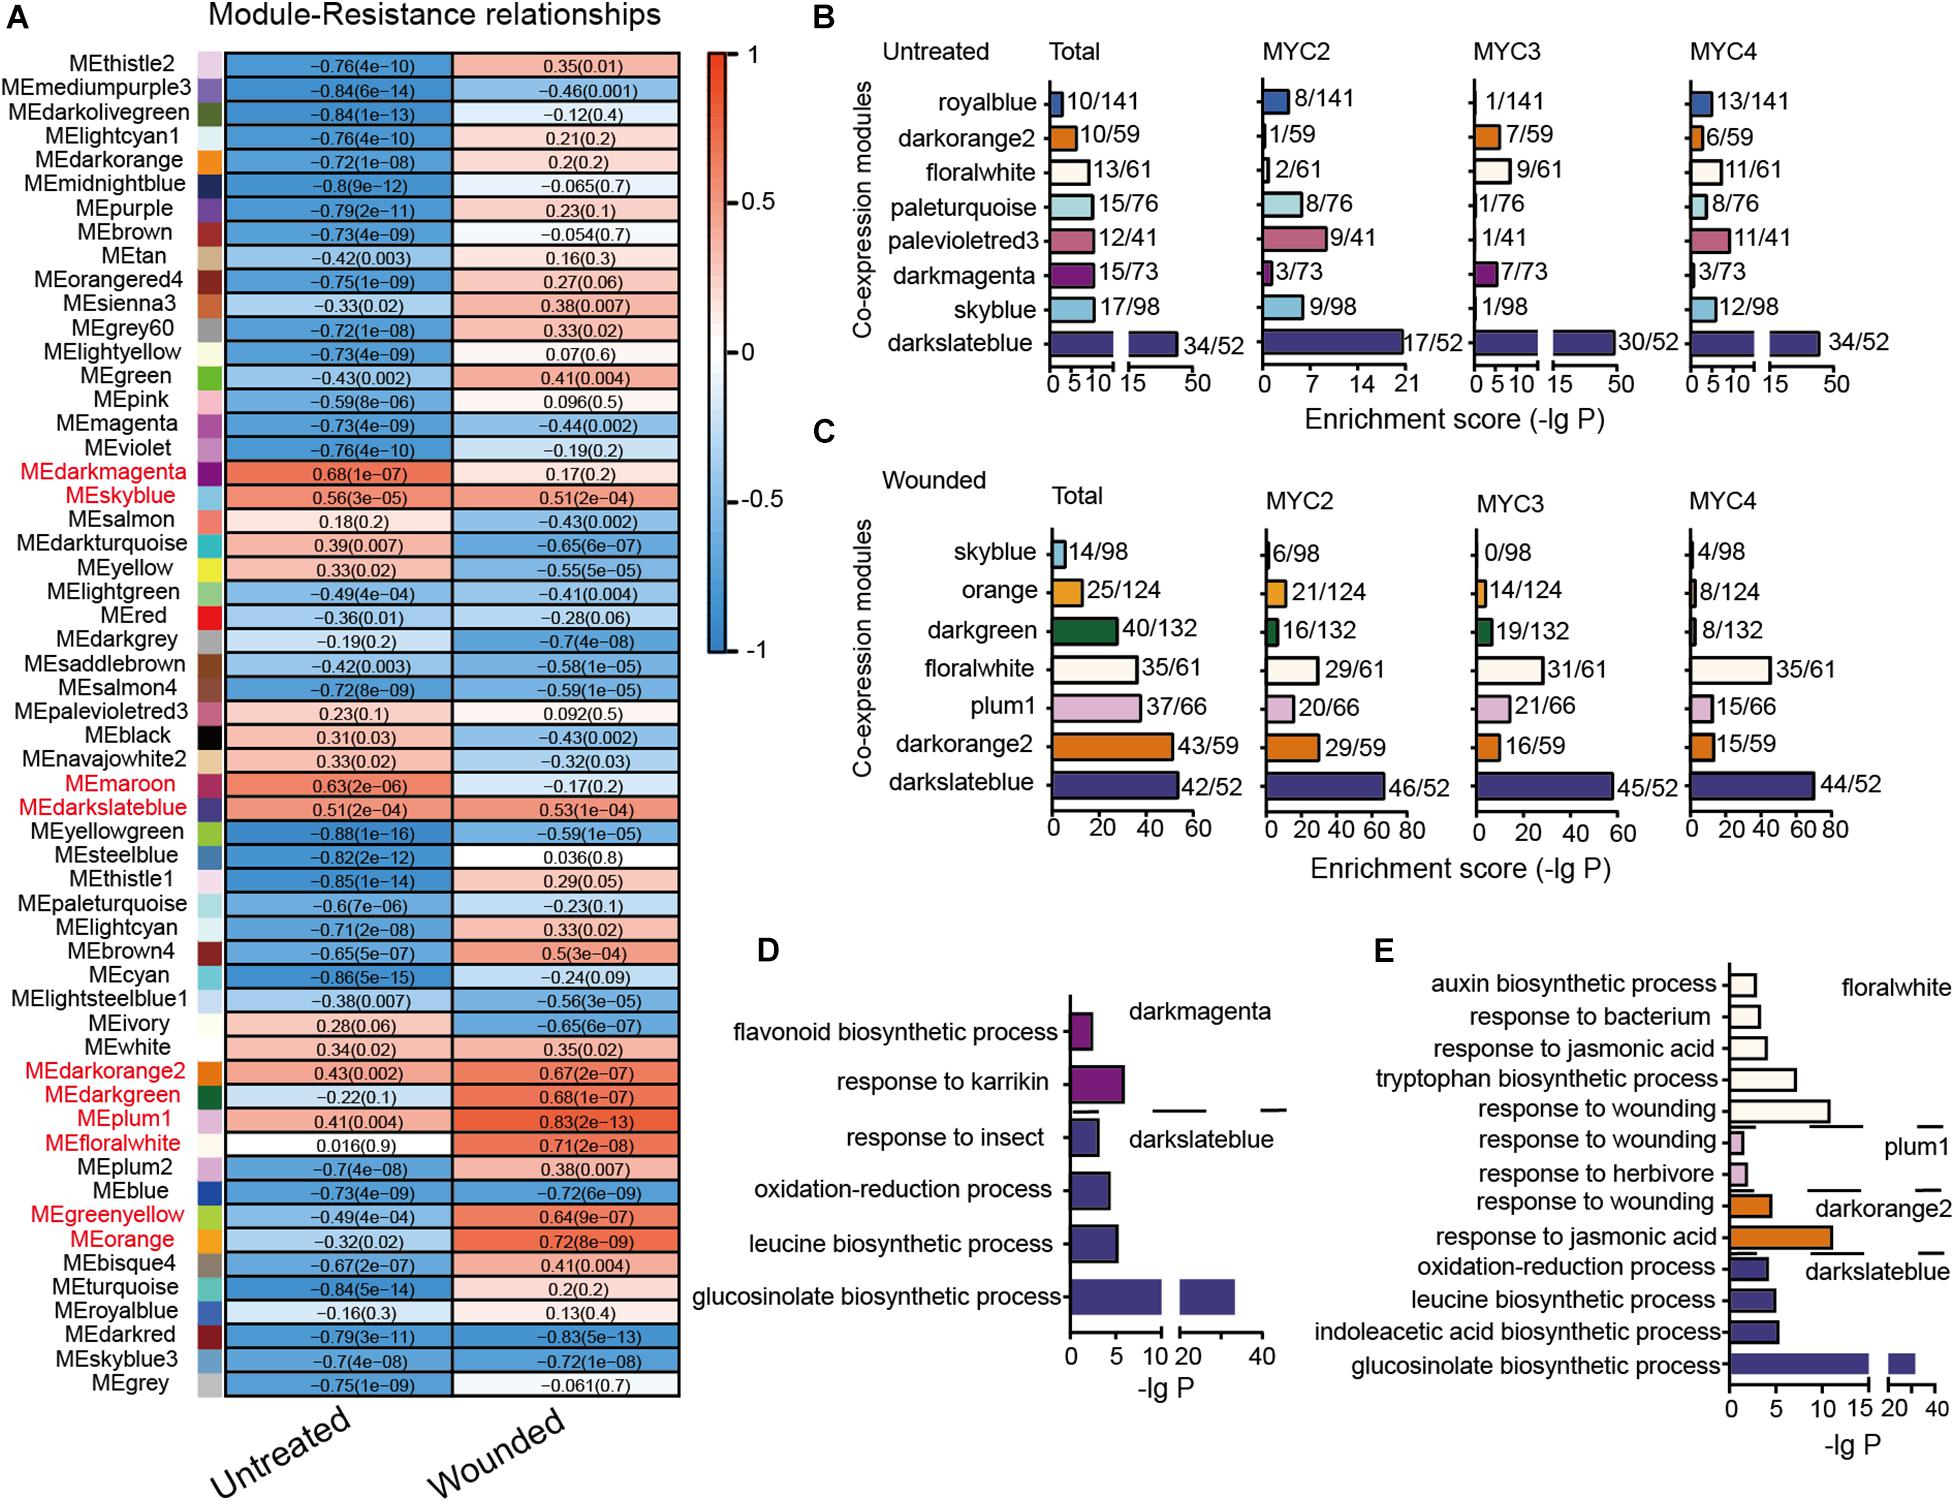
Figure 4. Module classification based on gene co-expression. (A) Correlation of the module eigengenes with cotton bollworm resistance. Red to blue stands for positive to negative correlations between the module eigengenes and the plant resistance to cotton bollworm. The numbers represent correlation coefficients; and the numbers in brackets stand for P-value. (B,C) MYC2-, MYC3-, and MYC4-affected genes of the untreated (B) and wounded (C) plants are enriched in the indicated modules. The a/b values above the bars indicate gene numbers affected by all the three MYCs (Total) or the indicated MYC (a) and gene numbers of the corresponding module (b). (D,E) GO analysis of MYC-affected genes from untreated (D) and wounded (E) plants that were distributed in the indicated modules.
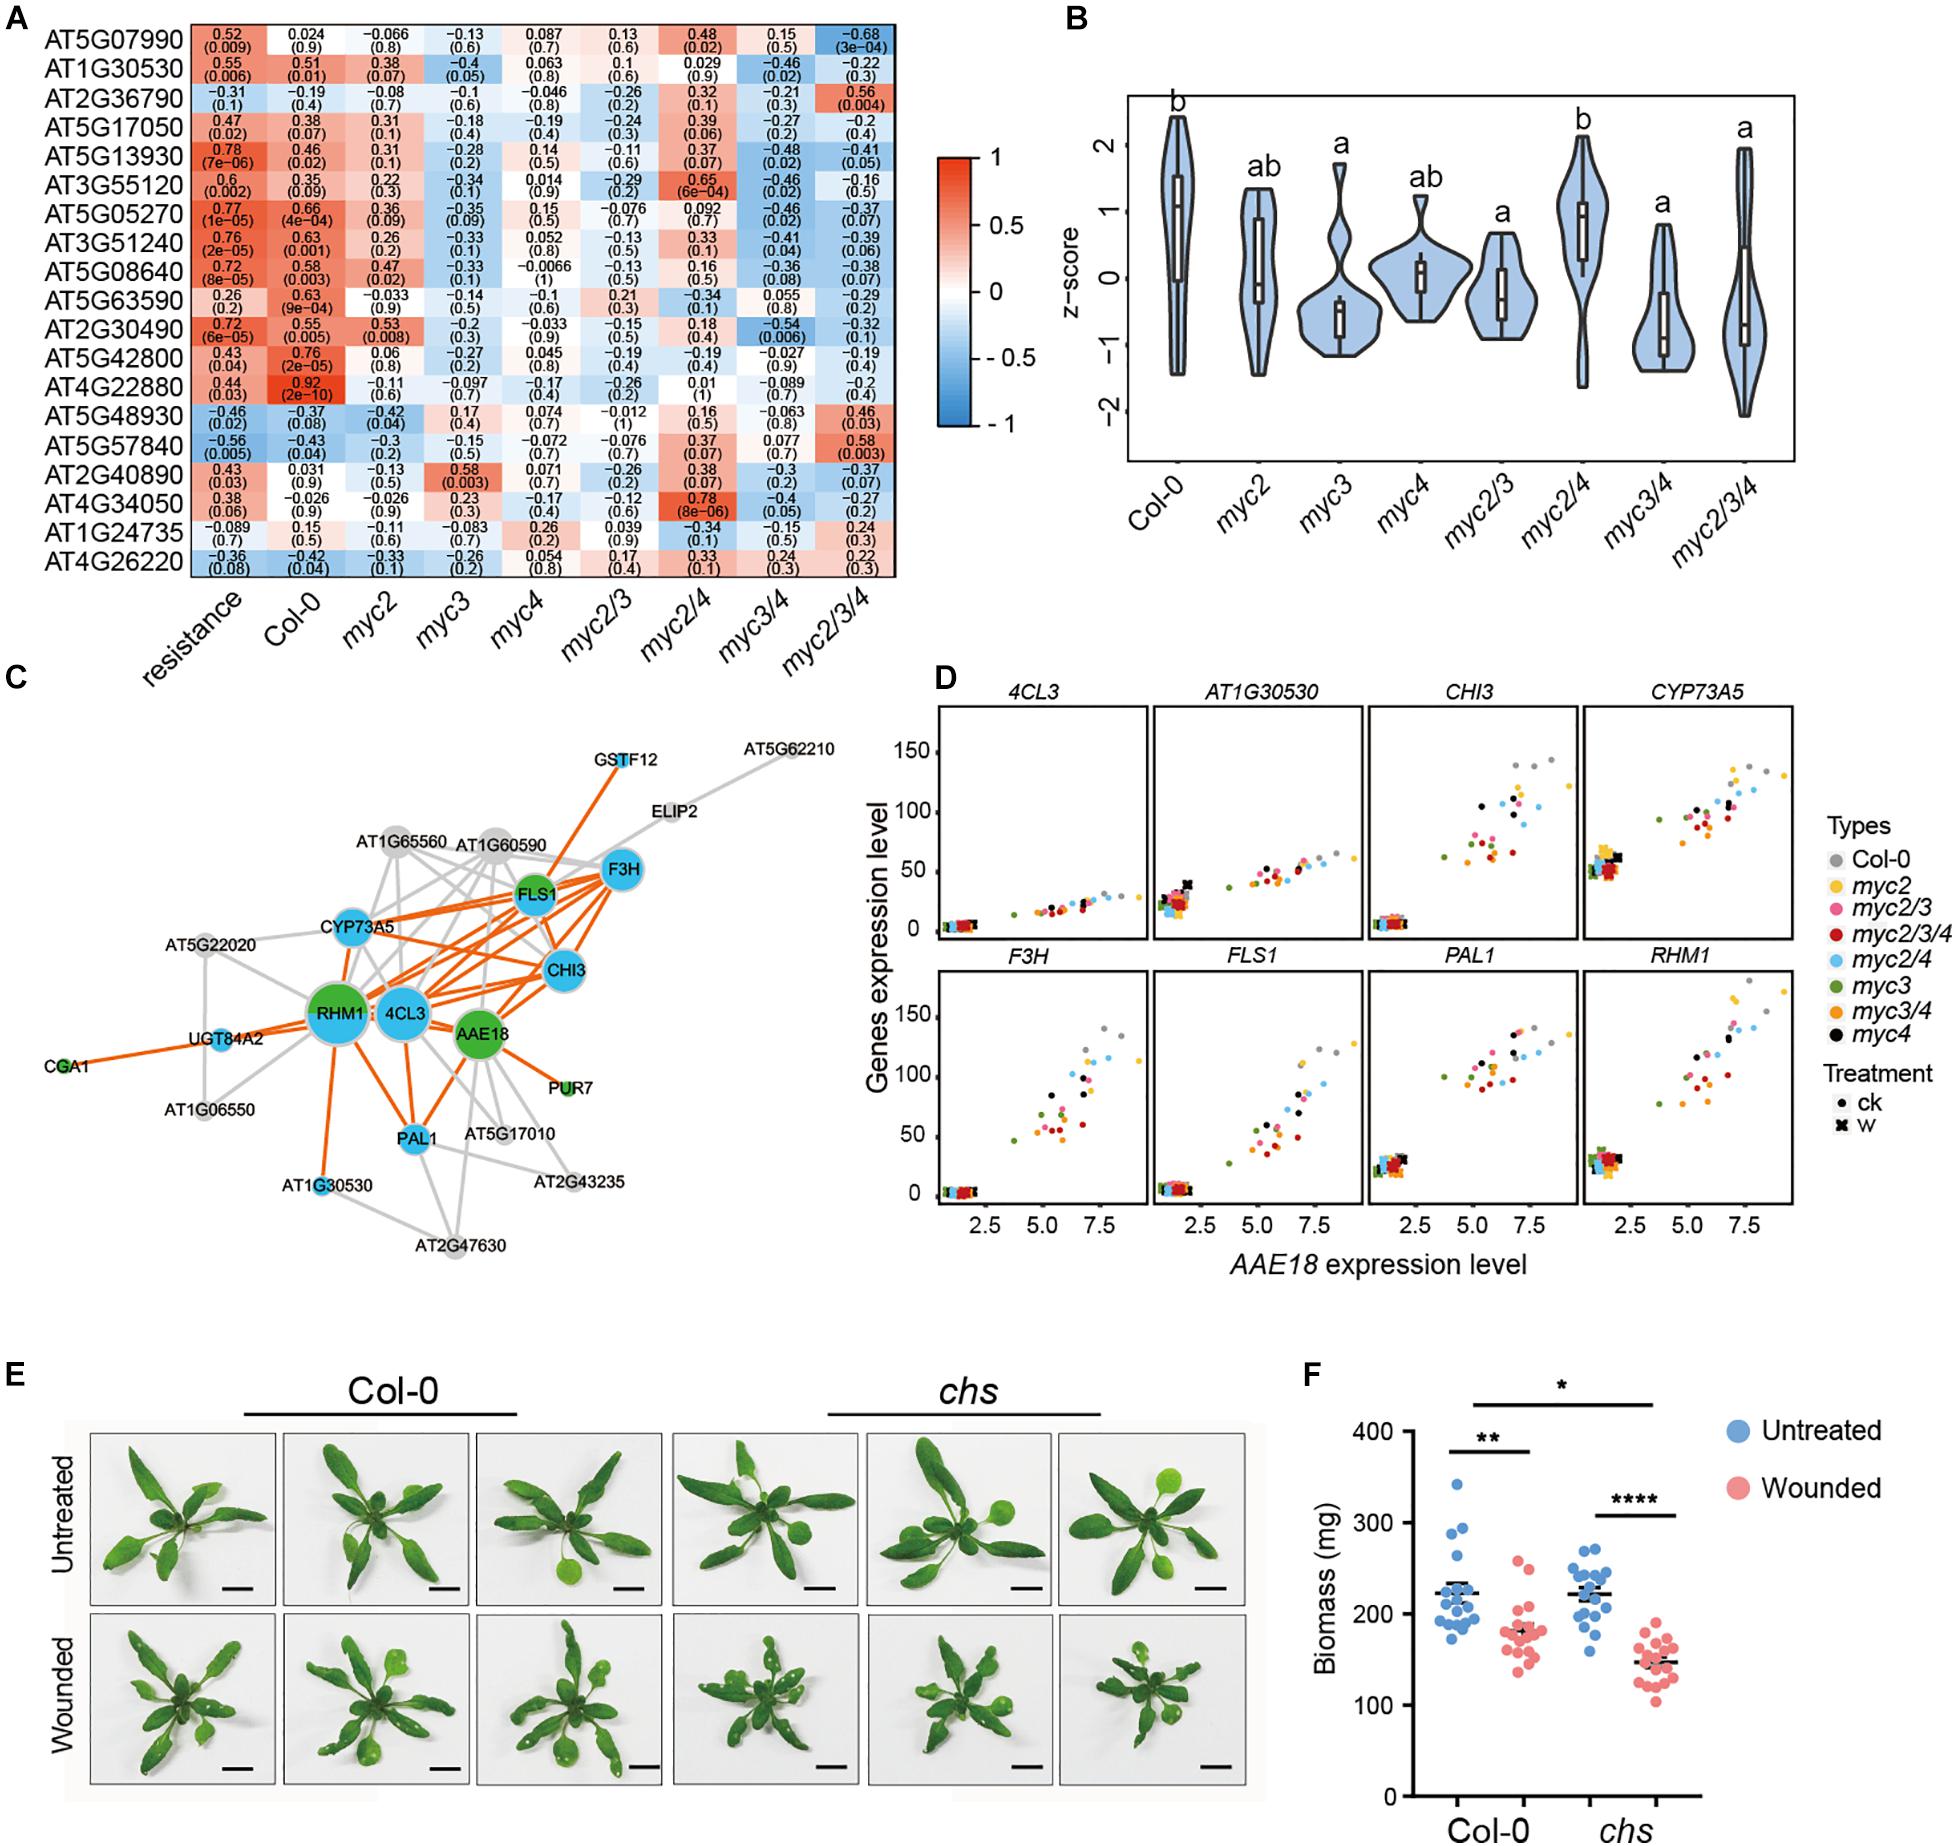
Figure 5. Flavonoids alleviate the growth inhibition caused by intermittent wounding. (A) Heatmap showing the effect of MYCs on the expressions of flavonoid synthesis genes positively associated with plant resistance. Red to blue represents the positive to negative correlation between gene expression and resistance. The number indicates correlation coefficient, and the number in brackets indicates P-value. (B) The violin plot of flavonoid gene expression in myc-related mutants in untreated plants. Z-score represent the normalized TPM of each gene. The detailed flavonoid gene information is presented in Supplementary Table 14. Data are analyzed by one-way ANOVA and Tukey’s HSD test. Different letters indicate significant differences, P-value < 0.05. (C) Co-expression network of flavonoid synthesis and growth-related genes. Blue and green stand for flavonoids synthesis genes and growth-related genes, respectively. (D) Scatter plot displays the co-expression of AAE18 with the eight flavonoid synthesis genes. X-axis stands for the AAE18 expressions (TPM), and Y-axis stands for the expressions (TPM) of the indicated genes in flavonoids synthesis. Dots represent the gene expressions in untreated samples, and crosses represent the gene expressions in wounding treated samples. (E,F) Images (E) and Biomass (F) of WT and CHS with intermittent wounding treatments. When plant has grown for 12 days, the first wounding treatment is performed, and the wounding treatment is performed every 3 days for a total of three times. (E) Scale bar, 1 cm. (F) Data are means ± SEM (n = 18) and analyzed by two-way ANOVA and Tukey’s HSD test.
*P < 0.05, **P < 0.01, ****P < 0.0001.