Welcome to Mao lab!
Differential Transcription and Alternative Splicing in Cotton Underly Specialized Defense Responses Against Pests
Abstract: The green mirid bug (Apolygus lucorum) and the cotton bollworm (Helicoverpa armigera) are both preferred to live on cotton but cause different symptoms, suggesting specialized responses of cotton to the two insects. In this study, we investigated differential molecular mechanisms underlying cotton plant defenses against A. lucorum and H. armigera via transcriptomic analyses. At the transcription level, jasmonate (JA) signaling was dominated in defense against H. armigera whereas salicylic acid (SA) signaling was more significant in defense against A. lucorum. A set of pathogenesis-related (PR) genes and protease inhibitor genes were differentially induced by the two insects. Insect infestations also had an impact on alternative splicing (AS), which was altered more significantly by the H. armigera than A. lucorum. Interestingly, most differential AS (DAS) genes had no obvious change at the transcription level. GO analysis revealed that biological process termed “RNA splicing” and “cellular response to abiotic stimulus” were enriched only in DAS genes from the H. armigera infested samples. Furthermore, insect infestations induced the retained intron of GhJAZs transcripts, which produced a truncated protein lacking the intact Jas motif. Taken together, our data demonstrate that the specialized cotton response to different insects is regulated by gene transcription and AS as well.

Figure 1. RNA sequencing (RNAseq) using sample groups from the untreated, H. armigera and A. lucorum infested cotyledons. (A) The flow diagram of the sample collection, sequencing, and analysis. The cotyledons were treated with H. armigera (HA) and A. lucorum (AL) for one day and the untreated cotyledons were used as control (CK). Total RNA of CK, HA, and AL samples with biological triplicates were sequenced and analyzed at both transcription and splicing levels. (B) The Venn diagrams of up- and down-regulated genes in cotton by H. armigera and A. lucorum. The overlapped regions stand for genes up- or down-regulated by both insects. (C) Scatter plot analysis of the total up-regulated genes by either insect feedings. The X- and Y-axis stand for the gene expression [Log2(FPKM+1)] in HA and AL, respectively. The blue and red spots indicate the genes with higher induction levels in HA and AL respectively (padj < 0.001). The gray spots indicate that the induction of these genes has no difference between HA and AL. (D) RT-PCR analysis of the 12 up-regulated DEGs from the RNA-seq results. Every four genes of both highly induced (first column), more highly induced in HA (second column) and more highly induced in AL (third column) were selected. Cotton cotyledons were treated as described in A. GhHIS3 was used as the internal standard. The expression in CK was set to 1. Error bar means ± SEM (n = 5 biological replicates). The results were consistent with the RNA-seq results. T-test, *P < 0.05.

Figure 2. Different contributions of JA and SA in cotton defense against insects. (A) GO enrichment of the DEGs with higher inductions by H. armigera (HA, blue) and by A. lucorum (AL, red) were analyzed, respectively. (B) RNA-Seq analysis of JA and SA related gene expressions. The up part is the Venn diagrams of the induced DEGs related to JA and SA. The green part stands for the genes related to JA, the orange part stands for the genes related to SA and the overlapped part stands for the genes both related to JA and SA. The bottom part is the violin plot of JA and SA related genes in CK, HA, and AL.The FPKM of each gene was normalized by z-score. The average z-scoe of each gene was showed in the violin plot and the long horizontal line represented for the median. The detailed JA and SA related gene information were listed in Supplementary Table S7. (C) qRT-PCR analysis of the selected DEGs which were more highly induced by H. armigera (up) and by A. lucorum (bottom) from RNA-Seq data. The cotton cotyledons were treated with JA and SA respectively and collected at 1, 4, and 24 h post treatment. The expression of indicated genes was detected by qRT-PCR. GhHIS3 was used as the internal standard. The expression of untreated cotton leaves (0h) was set to 1. Error bar means ± SEM (n = 4 biological replicates).
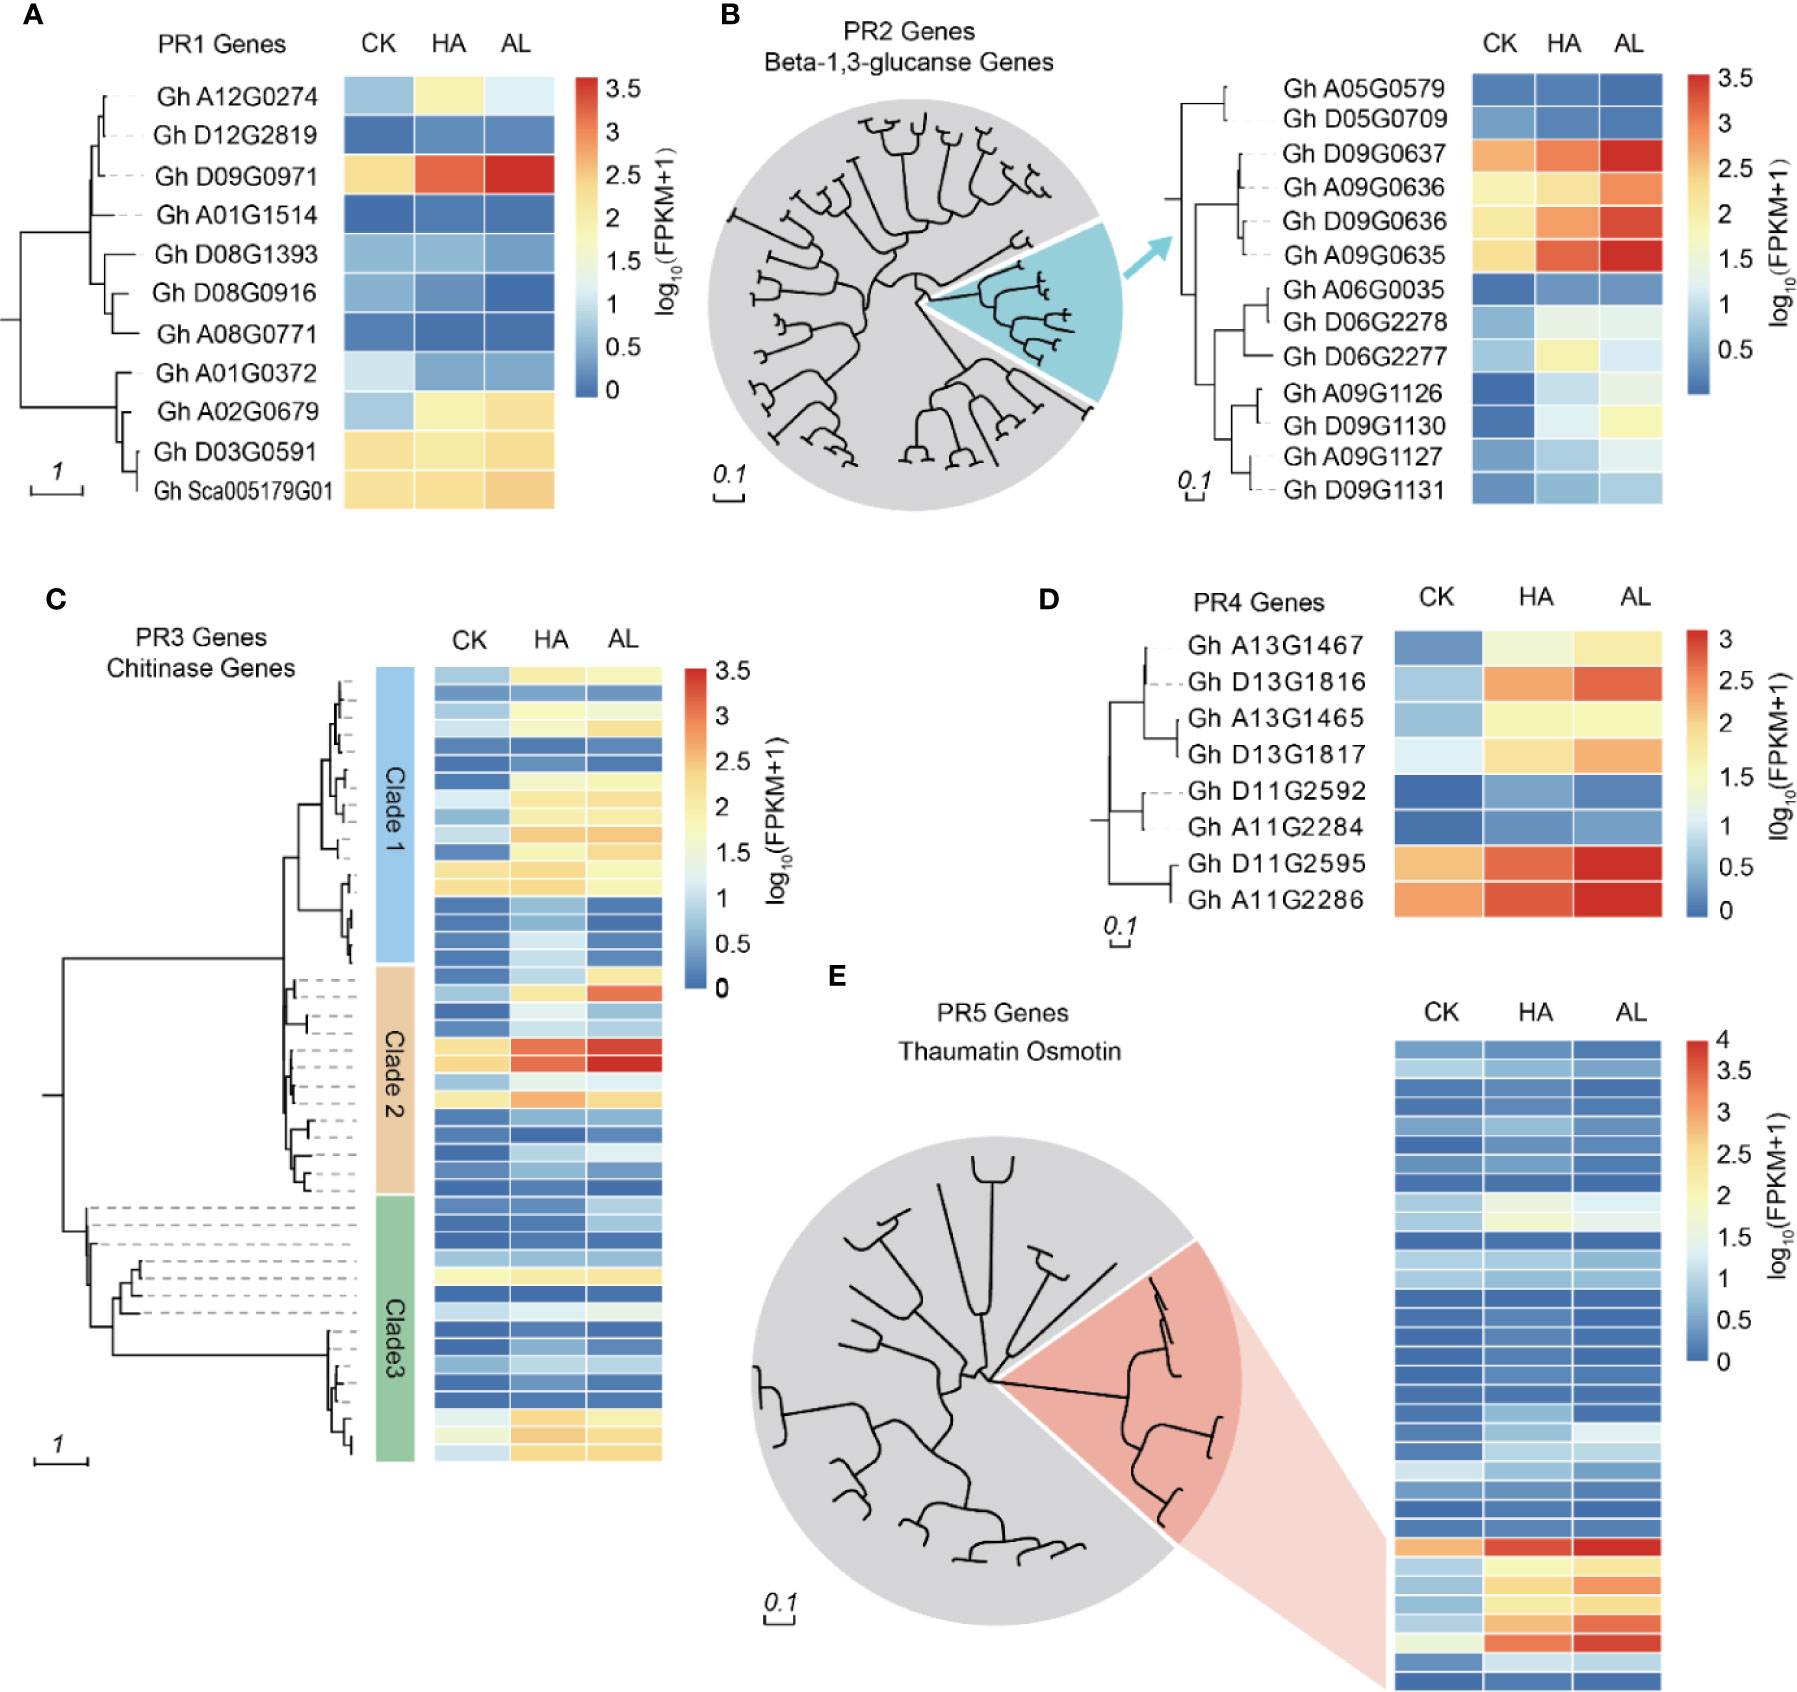
Figure 3. Phylogenetic analysis of PR genes and their transcription levels. Cluster analysis of PR1 (A), PR2 (B), PR3 (C), PR4 (D), and PR5 (E) family members in cotton. The heatmap in the right indicated the expression levels of the corresponding PR genes in untreated (CK), H.armigera (HA) and A. lucorum (AL) infested samples from the RNA-seq results. The detailed gene information was listed in Supplementary Table S8.
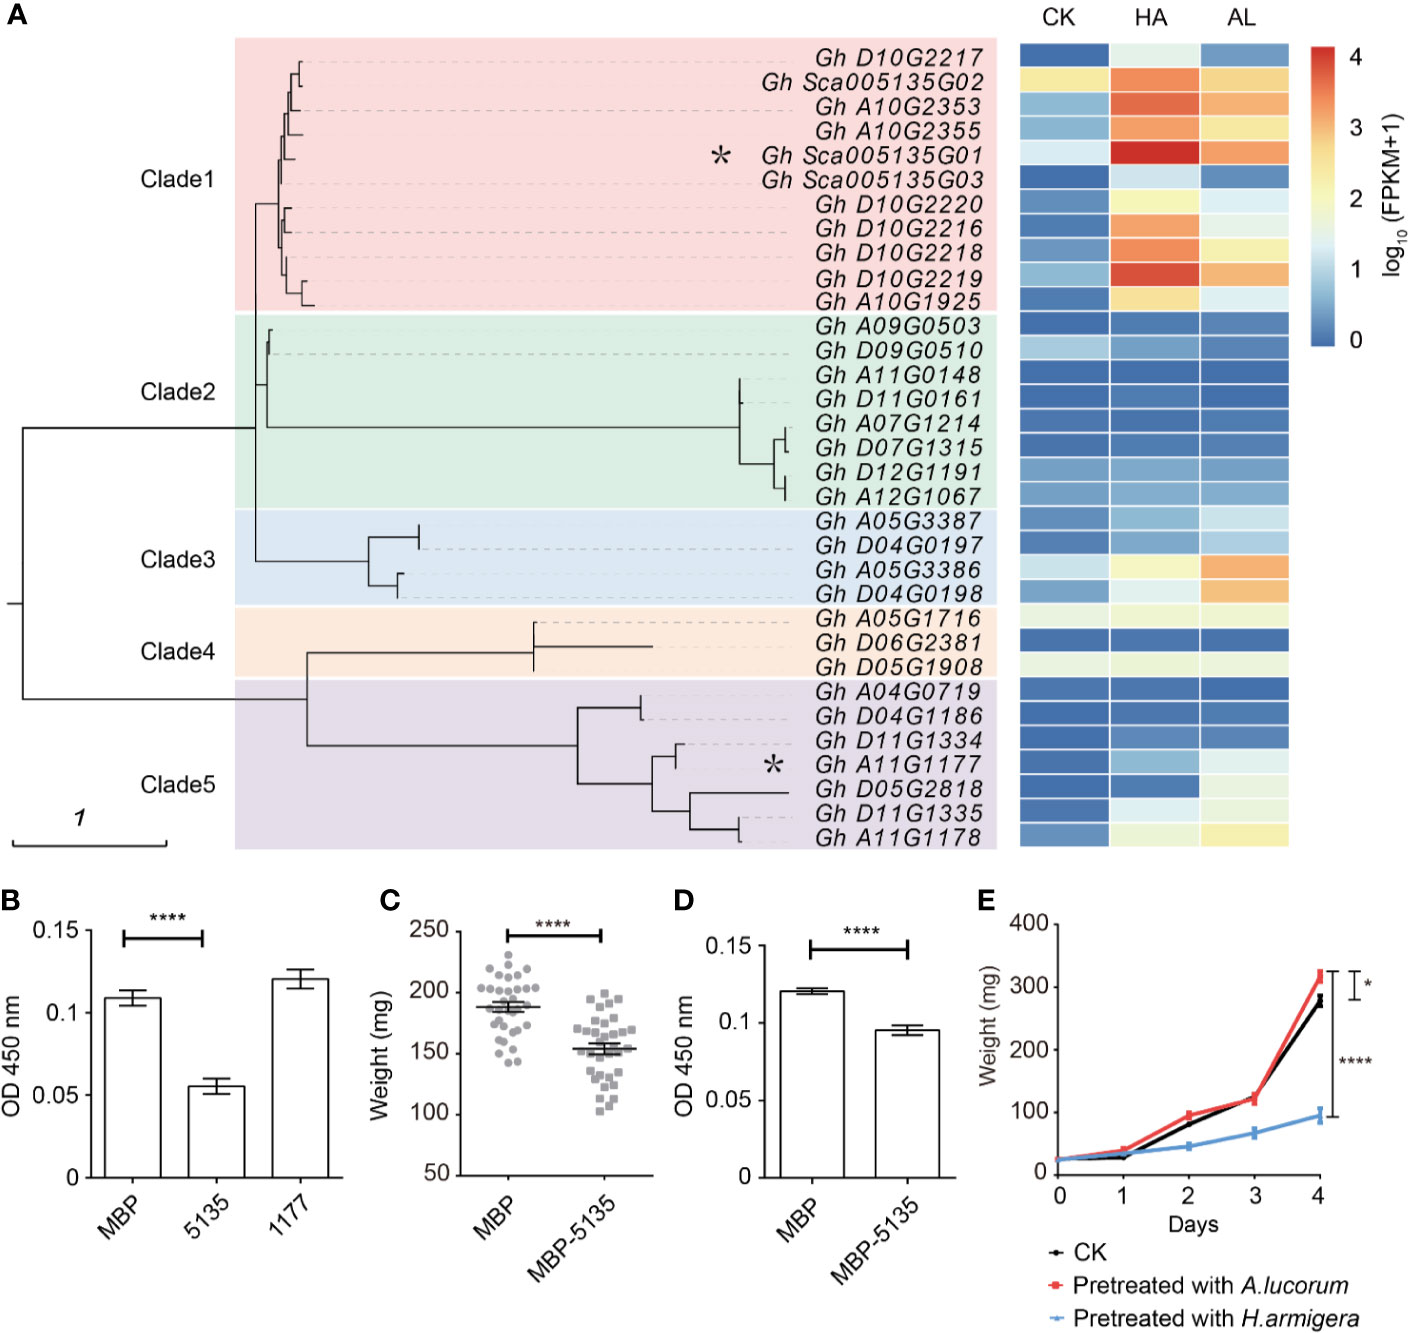
Figure 4. Differentially expressed protein inhibitors by H. armigera and A. lucorum. (A) Cluster analysis revealed that the serine protease inhibitors (SPIs) in cotton can be divided into five clades. The heatmap in the right indicated the expression level [lg(FPKM + 1)] of the corresponding SPI genes in untreated (CK), H.armigera (HA) and A. lucorum infested (AL) samples from the RNA-seq results. The SPI genes with an asterisk were used for the functional analysis. (B) The total proteinase activities of the larval gut fluids were inhibited by Gh_Sca005135G01(5135) instead of Gh_A11G1177 (1177). Gut fluids were incubated with the prokaryotically expressing proteins of MBP, 5135, and 1177, respectively. After incubation for 30 min, the proteinase activities of the gut fluids were detected. Error bar means ± SEM (n = 6 biological replicates). T-test, ****P < 0.0001. (C) Oral ingestion of 5,135 inhibited larval growth. The 2nd instar larvae were fed with the artificial diet (1/2 nutrition) mixed with the E. coli cells expressing MBP, 5,135 respectively for 5 days and the larval weight was recorded. Error bar means ± SEM (n = 30–35). T-test, ****P < 0.0001. (D) The total proteinase activities of the gut fluids from the larvae were determined. Error bar means ± SEM (n = 8 biological replicates). T-test, ****P < 0.0001. (E) The H. armigera larvae pre-fed plants showed enhanced resistance to its second feeding. The 15 days old cotton seedlings were pre-fed with H. armigera and A. lucorum for one day. The 2nd instar larvae were fed with the untreated (CK) and the insect pre-fed cotton cotyledons for 4 days and the weight of each individual was recorded. Error bar means ± SEM (n = 20–24). The weight of larvae on 4th day is analyzed by T-test. *P < 0.05, ****P < 0.0001. The insect feeding tests (C, F) were repeated for three times (independent experiments) and the results were consistent.
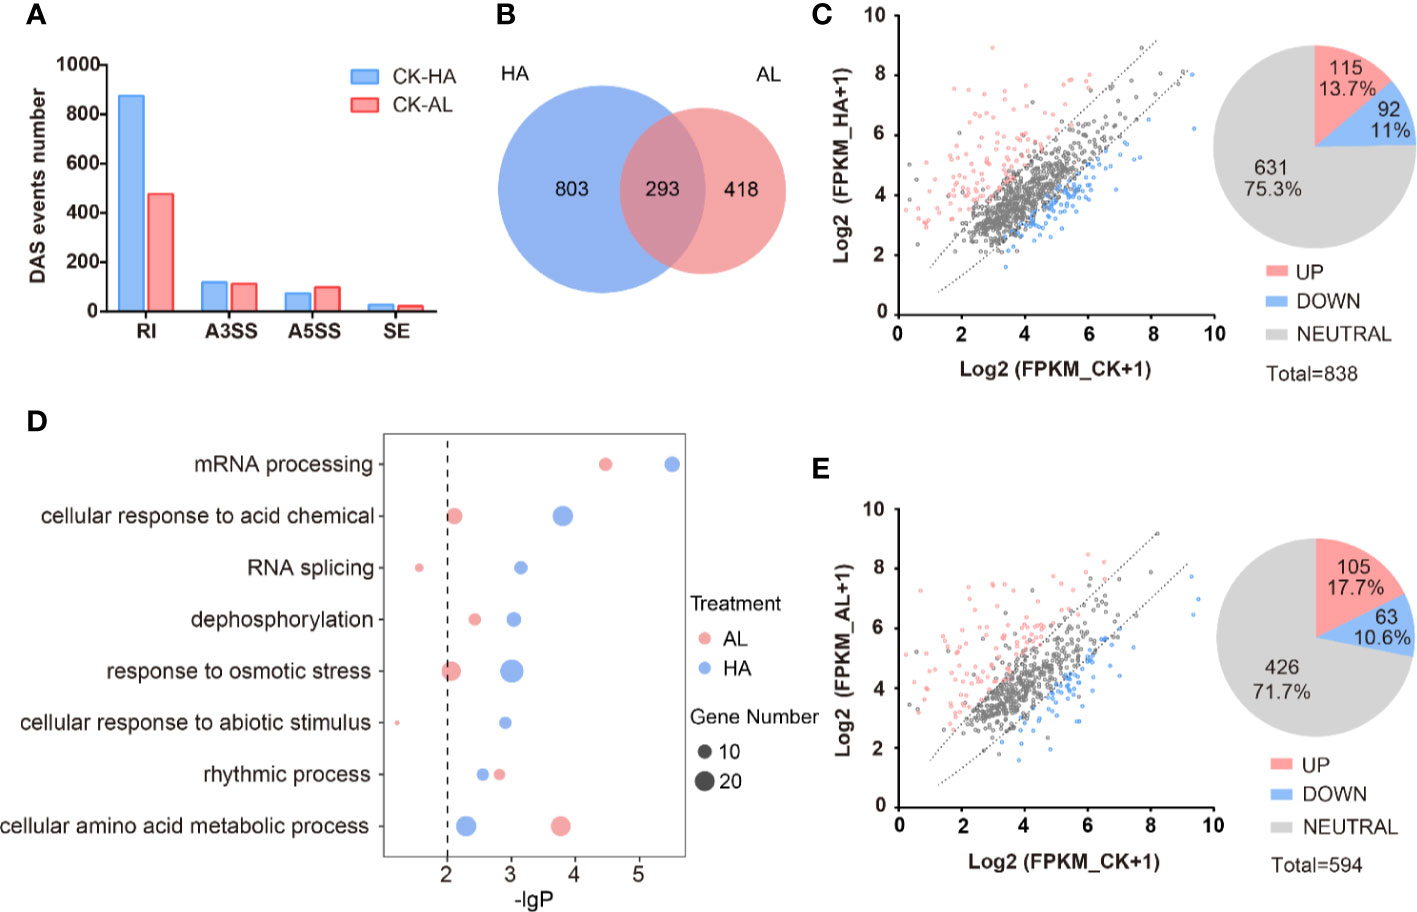
Figure 5. The alternative splicing profile of cotton was affected by the two insect infestations. (A) The differential AS (DAS) events caused by the H. armigera and A. lucorum infestations in cotton. (B) The Venn diagrams of DAS events caused by the H. armigera (HA, blue) and A. lucorum (AL, red) infestations. The overlapped region stands for the DAS events caused by both insects. (C, E) Scatter plot analysis of the transcription levels of the DAS genes in HA (C) and in AL (E). The X-axis stands for the gene expression (Log2(RPKM+1)) in CK and the Y-axis stands for the gene expression (Log2(RPKM+1)) in HA (C) and in AL (E). (D) GO enrichment analysis of the DAS genes from HA samples (blue spots) and from AL samples (red spots) were analyzed respectively. The size of the spot represents the number of DAS genes.
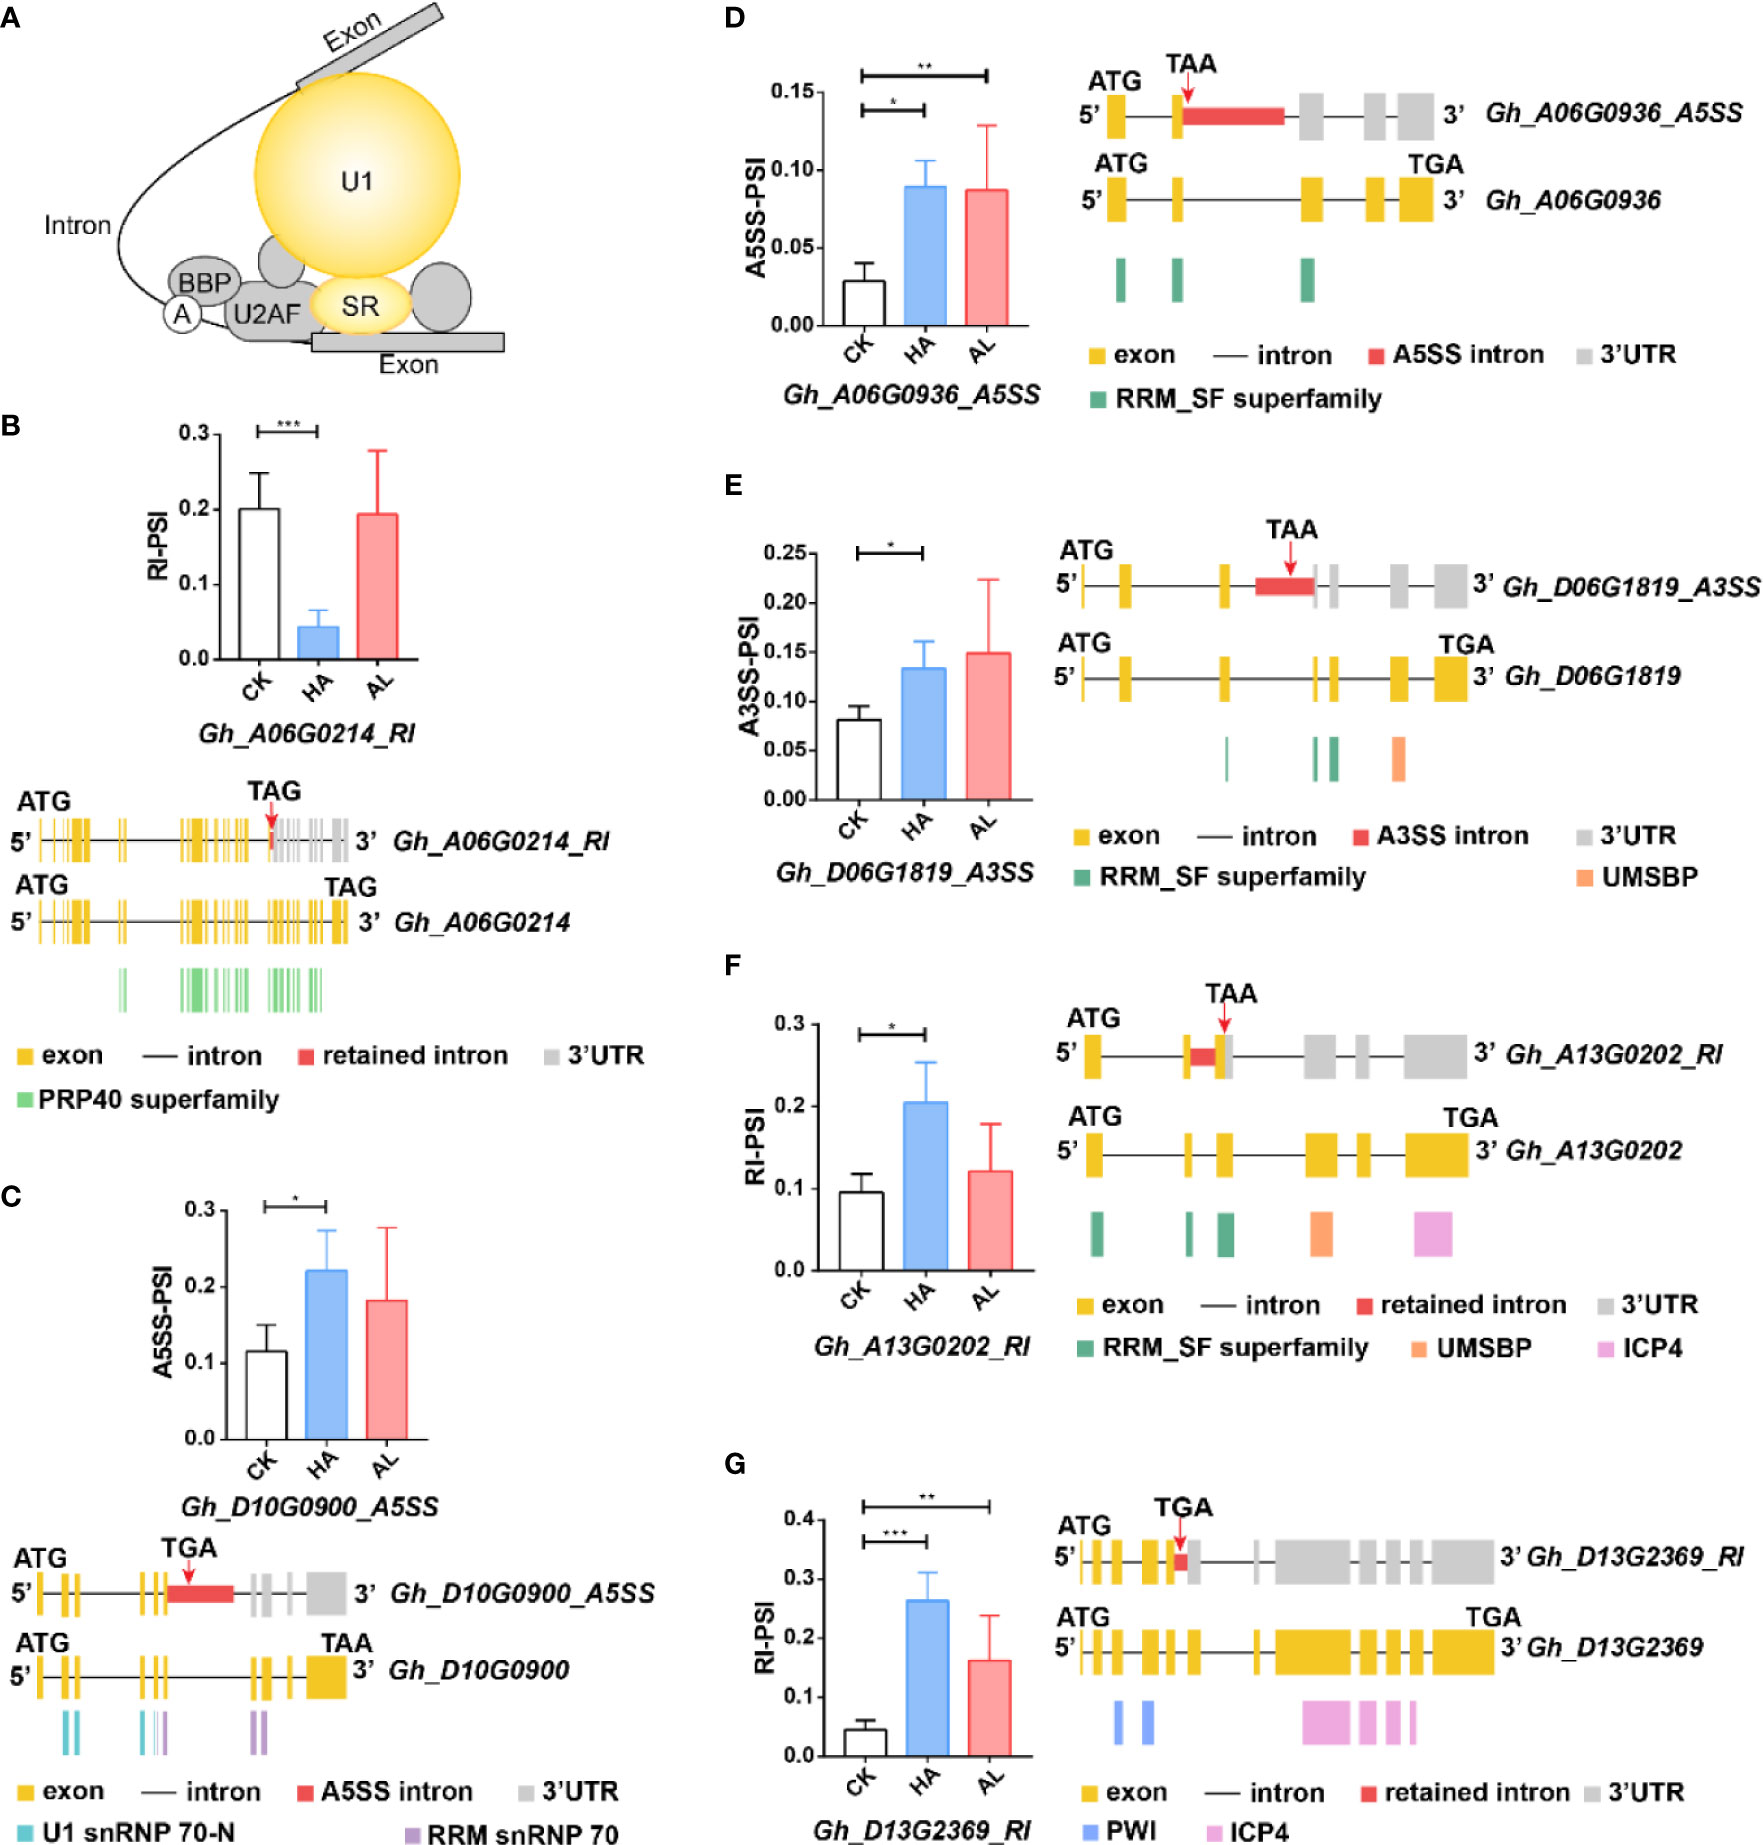
Figure 6. The differential alternative splicing of the splicing-related genes caused by the insect infestations. (A) The DAS genes involved in the splicing pathway were mainly U1-related and SR proteins which were colored in yellow. (B–G) The expression level of the representative variant splicing form in cotton by H. armigera (HA) and A. lucorum (AL) infestations. Error bar means ± SEM (n = 3 biolgical replicates). *FDR < 0.05; **FDR < 0.01; ***FDR < 0.001. The conserved domains of the DAS genes were marked in the corresponding color. ATG and TGA/TAA stand for initiation and termination codon respectively. The differential alternative splicing regions were marked in red. Yellow and gray boxes stand for exons and 3’UTR, respectively. The black line represents intron.
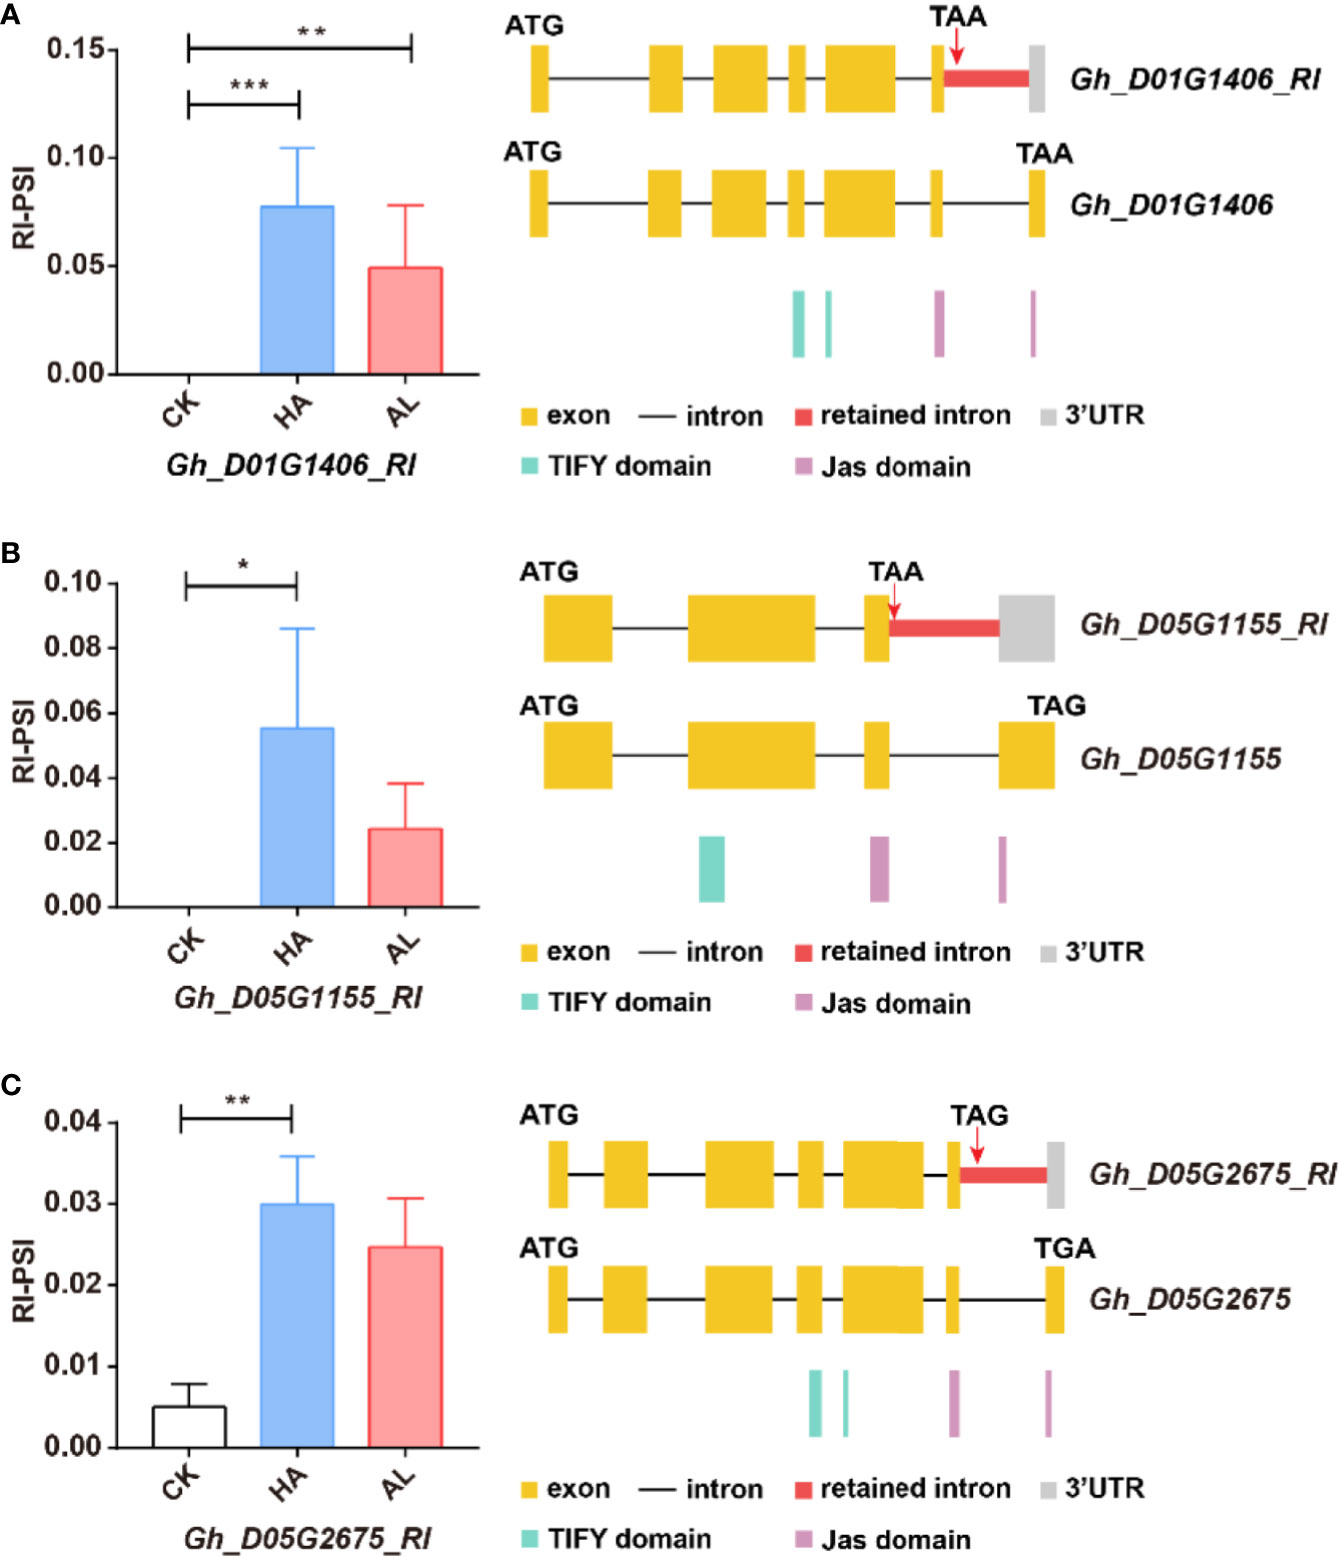
Figure 7. The RI variants of the GhJAZ genes were induced by insect infestations. Gh_D01G1406 (A), Gh_D05G1155 (B), and Gh_D05G2675 (C) encoded GhJAZ proteins, and the RI variants were promoted by H. armigera (HA) and A. lucorum (AL) infestations compared with the untreated cotton leaves (CK). Error bar means ± SEM (n = 3 biolgical replicates). *FDR < 0.05; **FDR < 0.01; ***FDR < 0.001. The Jas motif was marked in purple. ATG and TGA/TAA stand for initiation and termination codon respectively. The differential alternative splicing regions were marked in red. Yellow and gray boxes stand for exons and 3’UTR, respectively. The black line represents intron.